LinkedIn advertising in 2025 is more competitive than ever, with ad costs rising and the platform dominating 39% of B2B ad budgets. Here’s what you need to know:
- Median CPC: $3.94 (varies by industry, e.g., SaaS at $8.04, Finance at $2.59).
- Median CPM: $31–$38, rising to $50–$100 in high-competition industries.
- Median CTR: 0.52%, with top-performing campaigns exceeding 0.7%.
- Lead Gen Forms: Convert at 6–10%, double the rate of external landing pages.
Performance varies widely by industry and region. For example, APAC boasts the highest CTR (1.04%) and lowest CPC ($1.03), while EMEA faces higher costs and lower engagement. Video ads are gaining traction, with LinkedIn’s video inventory up 74% in 2025.
To succeed, focus on retargeting smaller, high-intent audiences, refreshing creatives every 14 days, and leveraging LinkedIn’s Conversions API to optimize for business outcomes. Campaigns with CTRs above 0.7% enjoy 15% lower CPCs, making engagement rates key to reducing costs.

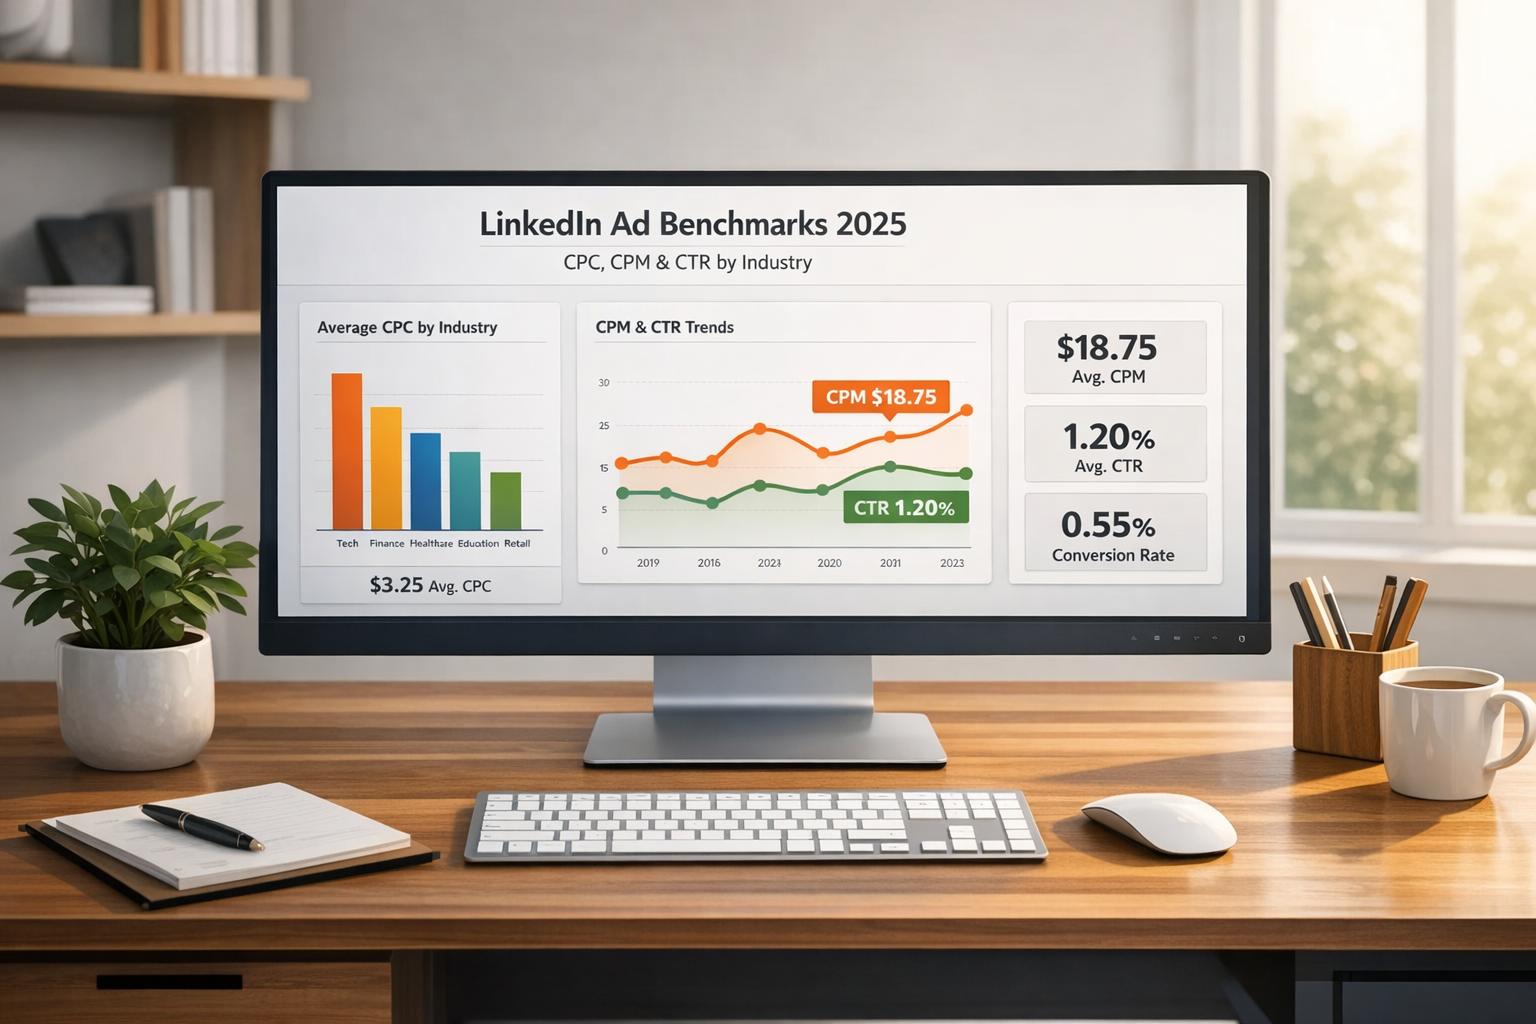
LinkedIn Ad Benchmarks 2025: CPC, CPM, CTR by Industry and Region
Overall LinkedIn Ad Benchmarks for 2025

Average CPC, CPM, and CTR Across All Campaigns
In 2025, LinkedIn campaigns show a median click-through rate (CTR) of 0.52%[2]. This means half of all campaigns perform above this rate, while the other half fall below. The median cost-per-click (CPC) is $3.94, though this can vary significantly depending on the industry and targeting approach[2].
When it comes to cost-per-thousand impressions (CPM), the median falls between $31 and $38 per 1,000 impressions[6], but in highly competitive scenarios, CPM can range from $50 to $100[10]. LinkedIn Lead Generation Forms tend to convert at rates between 6% and 10%, which is roughly double the 2% to 5% conversion rates of external landing pages[1][6].
| Metric | Median/Average | Range |
|---|---|---|
| Click-Through Rate (CTR) | 0.47% – 0.52% | > 0.60% (top performers) |
| Cost Per Click (CPC) | $3.94 | $2.44 – $7.85 |
| Cost Per 1,000 Impressions (CPM) | $31 – $38 | $50 – $100 (high competition) |
| Cost Per Lead (CPL) | $128 | $75 – $150 |
| Conversion Rate (Landing Page) | 2% – 5% | – |
| Conversion Rate (Lead Form) | 6% – 10% | – |
Campaigns achieving CTRs above 0.7% often enjoy 15% lower CPCs, making higher engagement rates a key factor in reducing costs[6].
These benchmarks can shift based on regional markets, as explored below.
Regional Differences in LinkedIn Ad Performance
Performance metrics can vary widely by region, influenced by local market dynamics. For example, APAC (Asia-Pacific) stands out with the highest average CTR at 1.04% and the lowest CPC at just $1.03[7]. LATAM (Latin America) follows with a 0.63% CTR and a $2.18 CPC[7]. In North America, the CTR averages 0.58%, while CPC is $3.39[7]. On the other hand, EMEA (Europe, Middle East, and Africa) faces tougher conditions, with a 0.28% CTR and a much higher CPC of $5.17[7]. Kostas from Huble highlights this challenge:
"EMEA has seen a decline across all key metrics, suggesting that the market may be oversaturated with LinkedIn ads, making engagement more challenging"[7].
| Region | Average CTR | Average CPC (USD) |
|---|---|---|
| APAC | 1.04% | $1.03 |
| LATAM | 0.63% | $2.18 |
| North America | 0.58% | $3.39 |
| EMEA | 0.28% | $5.17 |
| Global Average | 0.53% | $5.74 |
Advertisers targeting more mature markets like EMEA or North America should anticipate higher costs and reduced engagement unless they craft campaigns that truly stand out. A strong "pattern interrupt" in messaging can help overcome these challenges[7]. Tailoring strategies to match regional cost dynamics is essential for achieving better results.
LinkedIn Ad Benchmarks by Ad Format
Single Image Ads Performance
In 2025, Single Image Ads continue to deliver consistent results, with a global average click-through rate (CTR) of 0.50%–0.60% (0.56% globally) and a cost-per-click (CPC) ranging between $5 and $7 [6]. These ads are particularly effective for driving traffic, building brand awareness, and generating leads. They also provide a great opportunity to test different messaging efficiently. When paired with LinkedIn’s native Lead Gen Forms, Single Image Ads can lower the cost per lead by about 25% compared to sending users to external landing pages [6]. Now, let’s see how Carousel and Video Ads stack up.
Carousel and Video Ads Performance
Carousel Ads, designed for storytelling, achieve a CTR of 0.40%–0.49% with an average CPC of $2.15 [7]. This makes them a budget-friendly option for showcasing multiple features or products in a single ad.
Video Ads, on the other hand, deliver a CTR of 0.40%–0.44% and a CPC between $7 and $9 [6][8]. While they may cost more, they tend to drive higher engagement than static image ads. In 2025, LinkedIn’s video inventory grew by 74%, reflecting a shift toward creator-driven content strategies [6]. For conversion-focused campaigns, keep videos under 30 seconds, as the median completion rate is 23.02% [7]. Shorter videos – under 15 seconds – often perform even better in feed-based campaigns. Now, let’s dive into how Follower Ads perform for audience growth.
Follower Ads Performance
Follower Ads are designed to grow your LinkedIn page’s audience. These ads typically show a CTR of just 0.04% and an average CPC of $7.70 [7]. The cost to acquire a new follower averages around $11.00, making this format more suitable for audience-building goals rather than immediate conversions.
What’s the Average Click Through Rate for LinkedIn Ads? LI Ads Benchmark CTRs in 2025
sbb-itb-8725941
LinkedIn Ad Benchmarks by Industry
Industry benchmarks highlight the unique challenges and opportunities each sector faces, helping marketers fine-tune their strategies for LinkedIn advertising.
Technology and SaaS: High Competition, High Costs
For Technology and SaaS companies, LinkedIn advertising comes with steep costs. The median cost-per-click (CPC) in this sector hits $8.04, with a range between $5.00 and $8.00 [1][2]. Click-through rates (CTR) hover between 0.39% and 0.45% [1][9], while cost-per-thousand impressions (CPM) typically falls between $30 and $50. On average, cost per lead (CPL) sits at $100–$125 [1].
With such high costs, focusing on CPL and cost-per-acquisition (CPA) is crucial – strong CTRs mean little without quality leads. Leveraging LinkedIn’s native Lead Gen Forms can make a big difference, as they convert twice as well as external landing pages [1][9]. For high-ticket products, narrowing your audience to 1,000–10,000 members can reduce CPL by 30–50% compared to broader targeting [4].
Finance and Healthcare: Striking a Balance Between Cost and Engagement
Finance and Insurance campaigns perform well on LinkedIn, with CPCs ranging from $2.50 to $3.00 and CTRs between 0.49% and 0.56% [1][2][9]. These campaigns also generate a median of 393 engagements per campaign [2]. CPM costs range from $15 to $30, and CPL typically lands between $90 and $120 [1].
Healthcare campaigns, on the other hand, achieve a slightly higher CTR of 0.58% [1][9]. CPCs range from $3.87 to $7.00 [1][2], with CPMs between $30 and $45 [1]. Leads in this sector tend to cost $100–$150 [1]. Both industries benefit from using social proof, such as case studies and testimonials, which can improve campaign performance by 15–20%. Additionally, content that focuses on data insights and industry trends generates 22% more engagement than product-centric messaging [6].
Manufacturing, Retail, and Other Sectors
Manufacturing maintains a steady CTR of 0.49% [9], with CPCs between $5.00 and $6.00 and CPLs averaging around $100 [9].
Retail stands out with a strong CTR of 0.80% [9]. CPCs range from $4.00 to $5.00, and CPLs average around $80 [9], reflecting high engagement levels among retail professionals on LinkedIn.
Education is particularly efficient for lead generation, with a CTR of 0.42% [1][9], CPCs between $3.11 and $5.00 [1][2], and the lowest CPL at $60–$70 [1][9]. This makes it an ideal sector for campaigns focused on training and professional development.
| Industry | CTR Benchmark | CPC Benchmark | CPM Benchmark | CPL Benchmark |
|---|---|---|---|---|
| SaaS / Software | 0.39%–0.45% | $5.00–$8.04 | $30–$50 | $100–$125 |
| Finance & Insurance | 0.49%–0.56% | $2.50–$3.00 | $15–$30 | $90–$120 |
| Healthcare | 0.58% | $3.87–$7.00 | $30–$45 | $100–$150 |
| Manufacturing | 0.49% | $5.00–$6.00 | $30+ | ~$100 |
| Education | 0.42% | $3.11–$5.00 | $30+ | $60–$70 |
| Retail | 0.80% | $4.00–$5.00 | $25+ | ~$80 |
These benchmarks provide a clear picture of how different industries perform on LinkedIn, offering valuable insights for refining targeting and budget strategies in the next steps.
How to Optimize LinkedIn Ad Performance
2025 LinkedIn Ad Performance Trends
LinkedIn ad costs have climbed by 8% year-over-year, with total ad spending surging by 31.7% [3][6]. This sharp increase highlights a major shift in B2B marketing priorities. LinkedIn now accounts for 39% of total B2B ad budgets, making it the top choice for many marketers [5].
While costs are rising, the payoff is clear. LinkedIn delivers an impressive return on ad spend (ROAS) of 113% [5].
Video content is taking center stage on LinkedIn. Video views have grown by 52% year-over-year, and video inventory has expanded by 74%, now making up 28% of all impressions on the platform [6]. LinkedIn’s algorithm increasingly favors ads with higher engagement rates – campaigns boasting click-through rates (CTRs) above 0.7% can see cost-per-click (CPC) drop by as much as 15% [6]. However, in mature markets like EMEA and North America, CTRs are showing signs of decline due to market saturation and growing competition [7].
These trends point to the importance of fine-tuning your ad strategy. Let’s dive into actionable strategies to help you succeed.
Strategies to Improve Your LinkedIn Ads
If you want to cut costs and boost performance, implementing LinkedIn’s Conversions API (CAPI) is a must. CAPI reduces cost-per-acquisition (CPA) by 20% and increases attributed conversions by 31% [5]. Jeremy Sacramento from Dreamdata puts it best:
"Sending pipeline and revenue data to LinkedIn via CAPI ensures campaigns are optimized for actual business impact, not just clicks" [5].
Refreshing your ad creatives frequently is another essential tactic. Update creatives every 14 days to combat declining CTRs [6]. Test 3 to 5 variations at a time, and quickly phase out underperforming ones [4]. For video ads, aim for short clips – under 15 seconds – that are optimized for the LinkedIn feed to take advantage of the platform’s growing video engagement [6].
Using LinkedIn’s Native Lead Gen Forms can dramatically improve conversion rates. These forms convert at 6% to 10%, which is double the rate of external landing pages, while also cutting cost-per-lead (CPL) by about 25% [1][6]. Keep your forms simple – forms with too many fields (like 12 or more) can drive up CPL significantly [4].
Audience segmentation is critical for efficiency. Retargeting audiences of 500 to 5,000 users can deliver an ROI of 800%. Similarly, tight matched lists of 1,000 to 10,000 prospects can lower CPL by 30% to 50% compared to broader targeting [4]. For high-ticket products, smaller, hyper-targeted audiences consistently yield better pipeline quality and ROI than larger, generalized audiences [4].
Once your creative and targeting strategies are in place, the next step is ensuring your budget is aligned to maximize results.
How to Allocate Budgets Across Industries
To get the best ROI, budget allocation must be precise, reflecting both industry trends and the long B2B sales cycle. On average, B2B sales take 211 days, and LinkedIn impressions often start influencing buyers as early as 320 days before revenue is realized [5]. This lengthy timeline means consistent investment and patience are essential.
Industries like Technology, SaaS, and Healthcare face higher competition, leading to steeper CPCs and CPLs. While the costs are higher, the quality of decision-makers in these sectors often makes the investment worthwhile. On the other hand, industries like Finance and Education offer more cost-effective opportunities with lower acquisition costs [1][2].
When allocating budgets, consider both the sales funnel stage and audience intent. For top-of-funnel awareness campaigns, target broad audiences of 20,000 to 100,000+ members. While CTRs for these campaigns hover around 0.5%, CPLs can be higher, averaging $180 [4]. For conversion-focused campaigns, shift your budget to retargeting efforts. These tend to achieve CTRs of 0.8% and CPLs of $90, delivering an ROI of 400% [4]. Align your spending with realistic performance benchmarks for each audience and industry vertical to ensure optimal results.
Conclusion
Running a successful LinkedIn advertising campaign hinges on a strategy that’s rooted in data. The benchmarks shared here – like the median CTR of 0.52% and the median CPC of $3.94 – offer a solid starting point for assessing how your campaigns stack up [2]. These numbers can help pinpoint whether underperformance stems from creative missteps, targeting issues, or broader market dynamics.
LinkedIn continues to dominate the B2B marketing space. With the platform accounting for 39% of total B2B ad budgets and delivering an impressive 113% ROAS [5], it’s clear why many marketers are willing to pay a premium to connect with decision-makers. To make the most of this investment, focus on driving pipeline growth and revenue – not just racking up clicks.
Achieving success on LinkedIn is an ongoing process. Tactics like using the Conversions API (which can reduce CPA by 20% and increase conversions by 31% [5]), leveraging native Lead Gen Forms to double conversion rates [1], and updating ad creatives every 14 days can make a significant difference. Retargeting campaigns, in particular, yield conversion rates that are 2–4× higher [4][6].
Tools like Closely simplify this journey by automating LinkedIn outreach with AI-driven personalization and centralized campaign tracking. Features such as data enrichment, multichannel campaign support, and advanced analytics transform these benchmarks into actionable strategies.
LinkedIn’s influence on the B2B customer journey is substantial. With an average journey spanning 211 days, the platform’s impressions can start shaping decisions as early as 320 days before revenue is realized [5]. Success requires patience, consistency, and thoughtful budget allocation tailored to your industry and audience. Use these 2025 benchmarks as a guide, but let your unique business goals and audience insights steer the way.
FAQs
What are the best ways to lower CPC for LinkedIn ads?
To bring down your Cost-Per-Click (CPC) on LinkedIn ads, focus on three key areas: targeting, relevance, and performance tracking. Start by narrowing your audience to ensure your ads are seen by the right people. Use tools like retargeting lists or filter by specific job titles to reach users most likely to engage. A smaller, more precise audience often leads to better engagement and lower costs.
Next, create ad copy and visuals that truly connect with your audience. Ads that feel relevant and engaging tend to score better and cost less. Experiment with different headlines, images, and calls-to-action to find what works best. Once you spot the winning combinations, scale those up and pause the ones that aren’t performing.
Lastly, keep a close eye on your metrics in LinkedIn Campaign Manager. Compare your CPC to industry benchmarks – like $5–$8 for SaaS or $2.50–$3 for Finance – to gauge your performance. Use this data to tweak your approach and make your campaigns more cost-effective.
Which industries have the highest LinkedIn ad costs?
The SaaS/Software sector often faces the steepest LinkedIn advertising costs, with Cost-Per-Click (CPC) rates generally falling between $5.00 and $8.00. These elevated costs highlight the industry’s competitive landscape and the value of connecting with decision-makers and professionals on the platform.
Industries like Finance and Healthcare also experience higher LinkedIn ad expenses. This is largely due to the need for precise targeting and the specialized nature of their audiences. Being aware of these benchmarks allows advertisers to plan budgets wisely and fine-tune campaigns for better ROI.
Why is Click-Through Rate (CTR) important for optimizing LinkedIn ads?
Click-through rate (CTR) is an essential metric for gauging how well your LinkedIn ads connect with your audience. It reflects the percentage of people who click on your ad after viewing it, giving you a clear picture of how engaging and relevant your content is.
A high CTR doesn’t just mean your ad grabs attention – it also signals to LinkedIn’s algorithm that your content has value. This can result in better ad placements and potentially lower costs over time. By keeping an eye on your CTR and making adjustments as needed, you can ensure your campaigns encourage meaningful engagement and deliver a stronger return on investment.