LinkedIn analytics helps you understand how your posts perform and who engages with them. While you can’t see individual viewers for privacy reasons, LinkedIn provides insights like demographics, industries, and job roles of your audience. Here’s what you can do:
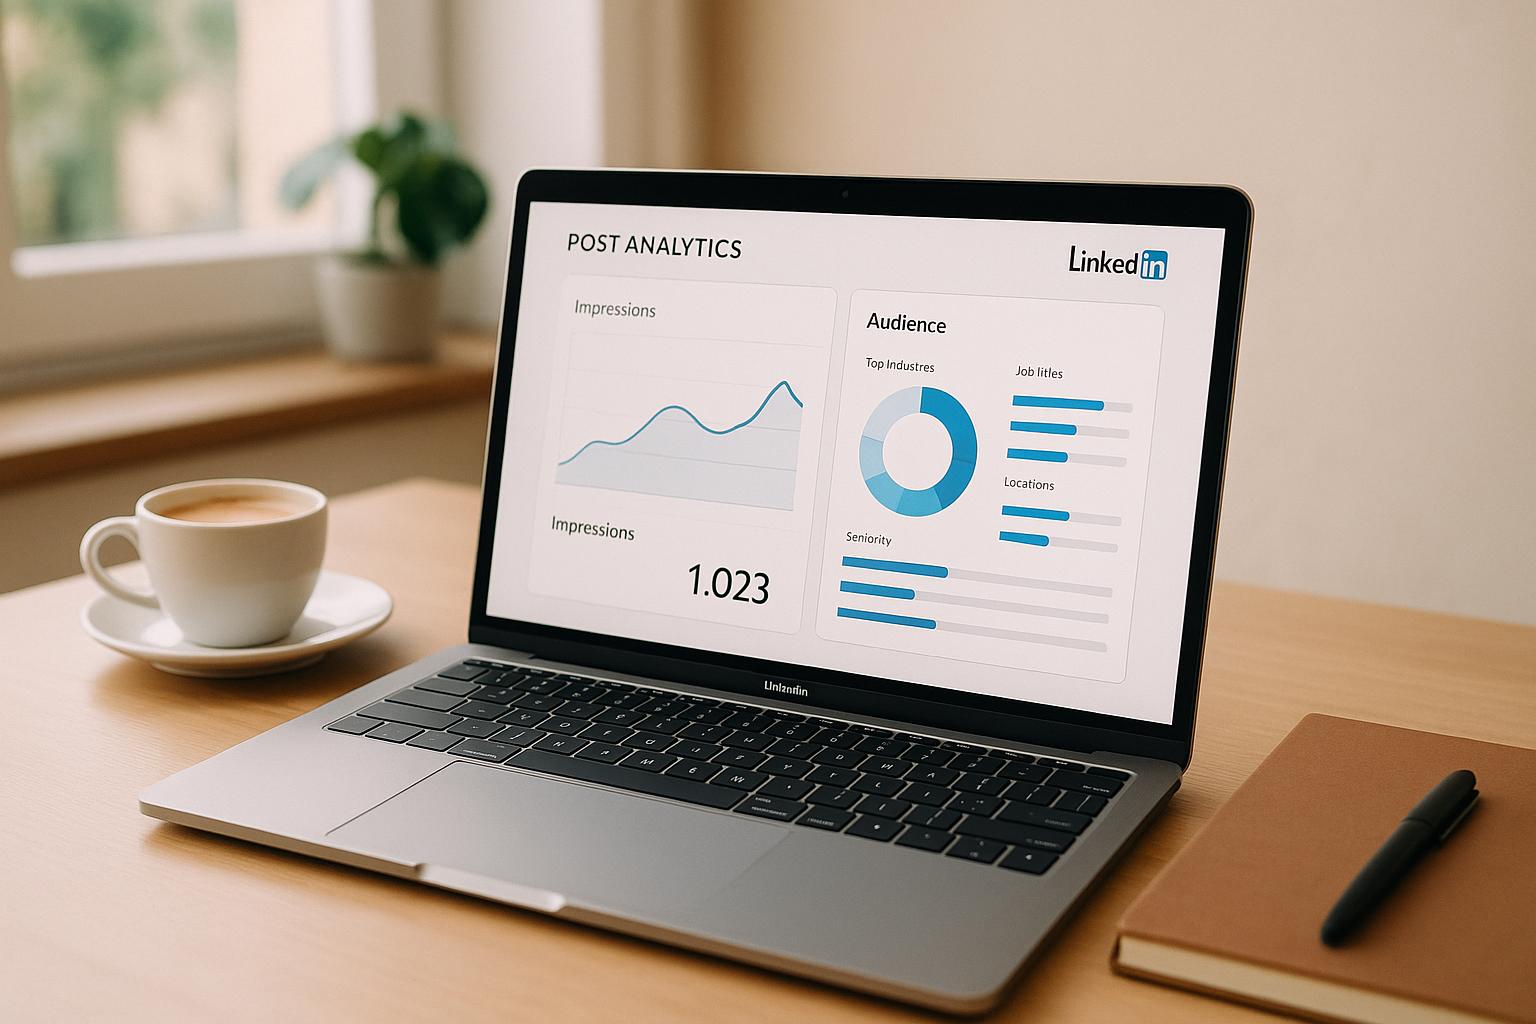
- Access Analytics: Go to your post, click "View Analytics" to see impressions, engagement, and audience details.
- Key Metrics: Track click-through rates, engagement rates, and follower growth.
- Audience Demographics: Learn about viewer industries, job functions, and seniority levels.
- Premium Features: Premium users can see "Who viewed your profile after this post?" for up to 100 viewers.
Use these insights to refine your content strategy, connect with the right audience, and improve engagement. Tools like Closely can further automate outreach and integrate analytics into sales efforts.
How to check analytics on your LinkedIn Posts | LinkedIn Tips
How to Access LinkedIn Post Analytics
You can easily access LinkedIn post analytics on both desktop and mobile devices. Here’s how you can find and review your post performance, no matter which platform you prefer.
Finding Post Analytics
If you’re on a desktop, follow these steps:
- Click the Me icon at the top of your LinkedIn homepage.
- Under the Manage section, select Posts & Activity.
- Choose the content type you want to analyze (Posts, Videos, Images, Articles, or Newsletter). Then, click the [Number] impressions link or the View analytics button to open the detailed analytics dashboard.
This dashboard provides in-depth insights about your audience and how they interact with your content.
Desktop vs. Mobile Interface
The desktop version of LinkedIn offers a more detailed analytics experience. Larger screens allow for clear visualizations, including charts, demographic breakdowns, and trend analysis. On mobile, the interface is simplified for smaller screens but still provides all the essential performance data. While some visual elements like charts may be streamlined, the core metrics remain consistent across both platforms [1].
Requirements for Analytics Access
All LinkedIn members have access to basic analytics. Once your post starts gaining traction, the analytics dashboard will display key metrics. Keep in mind that some data may take a moment to fully load, depending on the level of engagement your content receives.
What Data You Can See in LinkedIn Post Analytics
LinkedIn’s analytics dashboard is a treasure trove of information for understanding how your content performs and how your audience engages with it. The platform organizes metrics into categories like visitor data, follower stats, and engagement figures, along with detailed audience demographics. These insights are particularly valuable for shaping effective B2B marketing strategies and demonstrating the impact of your efforts [2]. By digging into these metrics, you can refine your content and outreach tactics to better connect with your audience.
Available Metrics Overview
The LinkedIn analytics dashboard offers a range of metrics that highlight your post’s performance. One key metric is Click-Through Rate (CTR), which shows how well your content motivates users to take action – like visiting your website. This is a great way to gauge whether your call-to-action is hitting the mark and driving meaningful results.
Other metrics, like profile views and follower growth, reveal how well your content is attracting new connections and expanding your professional network. These numbers help you assess the broader impact of your content strategy, beyond just likes and comments.
LinkedIn also tracks how different types of content – such as text posts, videos, images, and articles – perform with your audience [2][3]. This allows you to compare engagement levels across formats and identify what resonates most. With this knowledge, you can focus on replicating successful strategies in future posts.
Audience Demographics and Insights
LinkedIn goes beyond surface-level metrics by offering detailed demographic data about your audience. You can see insights like your audience’s location, industry, job function, company size, and seniority level [2]. These details give you a clearer picture of who is engaging with your content.
By understanding your audience demographics, you can create more targeted and relevant content. For instance, if your analytics show that a significant portion of your engaged audience consists of marketing directors in the tech industry, you can tailor your posts to address their specific challenges and interests. This level of insight helps ensure your content aligns with the needs of your audience.
What LinkedIn Does Not Show
While LinkedIn analytics provide a wealth of aggregated data, they don’t allow you to identify individual viewers of your posts. Privacy guidelines prevent the platform from revealing the names or profiles of specific users who engage with your content [1].
Instead, LinkedIn focuses on showing overall trends, demographic patterns, and engagement statistics. This approach ensures user privacy while still offering creators valuable insights to refine their strategies. By concentrating on broader audience behavior rather than individual tracking, LinkedIn strikes a balance between actionable data and respecting professional boundaries.
Using LinkedIn Analytics to Improve Engagement
LinkedIn analytics can do more than just present numbers – they can guide you toward strategies that genuinely improve how your audience interacts with your content. By interpreting the data and acting on it, you can make informed decisions to elevate your content’s impact.
Improving Content Based on Analytics
Your analytics dashboard is like a roadmap for creating content that resonates. Pay attention to engagement metrics such as reactions, comments, and reposts to see which formats are connecting with your audience best [4][1]. For posts featuring links or calls to action, the Click-Through Rate (CTR) can reveal how effective your messaging is [4]. These insights help you focus on the types of content that drive the most interaction.
Videos are another area worth analyzing. Look at metrics like view counts and average view time to understand how well your video content is holding your audience’s attention [4].
Demographic data is equally important. Insights into your audience’s professional backgrounds, industries, and locations allow you to fine-tune your content to better align with their interests and needs [4][1]. By weaving these details into your strategy, you ensure your messaging stays relevant and impactful.
Don’t overlook LinkedIn polls as a tool for direct feedback. As B2B Growth Expert Michelle J Raymond explains:
"Polls aren’t just for engagement – they’re mini market research tools!" [5]
When used thoughtfully, polls can uncover valuable information about your audience’s preferences, challenges, and opinions, giving you another layer of insight to shape your content strategy.
sbb-itb-8725941
Improving LinkedIn Performance with Closely
LinkedIn analytics can provide valuable insights, but Closely takes it a step further by turning those insights into automated and scalable outreach. It bridges the gap between understanding your audience and actively engaging with them on a larger scale. Let’s explore the standout features that make Closely a powerful tool for leveraging LinkedIn data.
Key Features of Closely
Closely offers a range of tools designed to transform LinkedIn analytics into actionable outreach. Its LinkedIn automation feature simplifies the process of reaching out to engaged viewers, turning them into potential prospects. With AI-driven personalization, you can craft tailored messages that reference specific posts or themes that resonated with your audience.
The platform also includes data enrichment capabilities, allowing you to collect additional contact details for LinkedIn users who interact with your posts. This means you can extend your outreach beyond LinkedIn’s messaging system when targeting high-value prospects identified through your analytics.
Another highlight is Closely’s advanced reporting, which goes beyond LinkedIn’s standard metrics. It lets you track the entire customer journey – from the first interaction with your content to eventual conversions. Plus, Closely integrates smoothly with popular CRM systems, ensuring that LinkedIn insights flow directly into your sales pipeline without missing a beat.
Benefits of Automation for LinkedIn Engagement
Manually reaching out to everyone who interacts with your LinkedIn posts can quickly become overwhelming, especially as your audience grows. Closely simplifies this process by automatically adding engaged viewers to personalized nurture sequences across LinkedIn messages, emails, and other targeted content. This ensures every potential lead is followed up with, while still maintaining the personal touch that makes LinkedIn connections effective.
Closely also features a unified inbox that consolidates responses from all your outreach channels. This makes it easier to manage ongoing conversations, particularly for sales teams and recruiters juggling multiple touchpoints with prospects across various platforms.
Connecting Analytics to Sales Results
Closely doesn’t just automate engagement – it ties those interactions directly to measurable sales outcomes. One of the biggest challenges with LinkedIn analytics is linking content performance to actual business results. Closely addresses this with lead scoring, which helps you prioritize prospects based on their engagement with your posts.
With robust CRM integrations and webhooks, Closely connects LinkedIn analytics directly to your sales systems. This allows you to measure the ROI of your LinkedIn strategy by identifying which posts generate the most qualified leads and conversions.
For larger teams, Closely’s team management features make it easy to coordinate LinkedIn campaigns. Team members can collaborate on outreach efforts, maintain consistent messaging, and track shared performance metrics across all LinkedIn activities.
Pricing starts at $49 per month for the Starter plan, which includes one account and 1,000 credits. The Growth plan, at $127 per month, supports three accounts and 3,000 credits.
Best Practices for LinkedIn Post Analytics
Getting the best results from LinkedIn analytics takes consistent effort and smart strategies. The difference between casual users and those who achieve meaningful business outcomes often lies in how systematically they analyze data and optimize content.
Monitor Analytics Regularly
Make it a habit to review LinkedIn analytics weekly, focusing on metrics like engagement rate, click-through rate, and audience demographics. Weekly reviews strike the right balance – you’ll have enough data to identify patterns without being distracted by daily fluctuations that might not reflect real trends[7].
Here’s why these metrics matter:
- Engagement rate: This tells you how much your audience interacts with your content. It’s calculated as clicks + likes + comments + shares + follows ÷ impressions.
- Click-through rate (CTR): This shows how often people click on your content after seeing it. It’s calculated as clicks ÷ impressions.
- Audience demographics: This helps you understand who’s engaging with your posts, giving insights into their job roles, industries, and locations.
To make tracking easier, create a simple spreadsheet or document where you record these metrics weekly. Pay attention to which posts perform best, what topics resonate with your audience, and any shifts in follower demographics. Over time, this historical data will help you spot long-term trends and seasonal patterns in your audience’s behavior.
If you notice changes in your audience demographics, adjust your messaging accordingly. For example, if more senior executives start engaging with your content, consider creating posts that address their specific challenges and concerns.
Test Different Post Formats
Once you start identifying trends from your analytics, it’s time to experiment with different post formats to boost engagement. Testing content formats is where many LinkedIn users see the biggest improvements in how their audience interacts with posts. LinkedIn offers a variety of formats, including text updates, images, videos, documents, polls, and carousels[8][9]. Each format performs differently depending on your audience and industry.
Begin by establishing a baseline for your current posting style. Then, introduce one new post format or call-to-action each week and track its performance. Use simple notes or tags in your analytics tracking system to document results for each format. This will help you identify which types of content drive the highest engagement and reach.
Timing also plays a role in LinkedIn engagement. Experiment with posting at different times during the week to see when your audience is most active. For many professionals, LinkedIn is most active during commute hours (7:00–9:00 AM and 5:00–7:00 PM EST) and lunch breaks (12:00–1:00 PM EST). However, your audience may follow different patterns, so testing is key.
Follow Privacy and Professional Guidelines
As you refine your performance strategies, it’s important to approach outreach with respect and professionalism. Let respect guide every decision you make based on LinkedIn analytics insights. While it might be tempting to reach out to everyone who engages with your posts, avoid aggressive follow-up tactics that could harm your reputation[7].
When reaching out, keep messages brief and professional. Personalize your outreach by referencing shared interests or topics, but avoid mentioning private details or making assumptions based on someone’s engagement patterns. For example, if someone frequently interacts with your content on a specific topic, you could mention that shared interest in a connection request or message, but steer clear of overly promotional language.
LinkedIn’s community guidelines explicitly prohibit spam and unsolicited promotional messages[6]. Just because someone liked your post doesn’t mean they’re open to receiving a sales pitch. Focus on building genuine professional relationships rather than treating every interaction as a sales opportunity.
Transparency is also crucial. If you’re using LinkedIn analytics to shape your content strategy or outreach, be upfront about your professional goals while respecting others’ time and privacy. Always remember that LinkedIn analytics provide aggregated demographic data, not personal details about individual users[6]. Use this data to better understand your audience as a group, rather than making assumptions about specific individuals.
Conclusion
LinkedIn analytics offer a powerful way to understand your audience and fine-tune your content strategy. By keeping an eye on key metrics like engagement rates, click-through rates, and audience demographics, you can make smarter, data-backed decisions to boost your visibility and strengthen professional connections.
The most effective LinkedIn users do more than just share posts – they dig into performance data to uncover what truly resonates with their audience. These insights can elevate your LinkedIn presence from casual interactions to a strategic tool for business growth. That said, relying solely on LinkedIn’s native analytics can limit your ability to dive deeper into performance trends.
While LinkedIn’s built-in tools provide a good starting point, they lack advanced features like detailed filtering, interactive visualizations, and seamless content comparisons. This is where tools like Closely come into play, offering a streamlined approach for professionals aiming to maximize their LinkedIn impact.
Closely enhances your LinkedIn analytics by automating tasks like tracking metrics, scheduling posts at optimal times, and linking content performance directly to sales outcomes. With Closely, you get deeper insights without the manual effort, allowing you to focus on creating high-quality content[7][10].
By combining LinkedIn’s analytics with advanced tools, you can craft a well-rounded strategy for professional networking. This approach helps you pinpoint top-performing content, automate follow-ups with engaged users, and scale successful tactics – all while maintaining the personal touch that makes LinkedIn so effective for building relationships.
This structured, data-driven method not only respects privacy but also empowers you to refine your strategy, boost engagement, and achieve goals like generating leads, increasing brand awareness, or growing your network in targeted industries[6].
FAQs
How can I use LinkedIn analytics to improve my posts and boost engagement?
LinkedIn analytics offers a powerful way to fine-tune your content strategy. It provides insights into who’s viewing and engaging with your posts, which topics resonate most with your audience, and the times they’re most active. By tracking metrics like impressions, clicks, and engagement rates, you can tailor your content to better match your audience’s preferences.
You can also dig into viewer demographics and engagement trends to refine your posting schedule and focus on the types of content that spark the most interaction. These insights can boost your visibility, expand your reach, and help you hit your professional targets – whether you’re in sales, marketing, or recruitment.
What’s the difference between LinkedIn’s free and Premium analytics?
LinkedIn’s free analytics offer a snapshot of activity, like the number of profile views or post engagements. But if you’re aiming for deeper insights, Premium analytics steps it up a notch. With Premium, you can uncover details like exactly who’s viewing your profile, a breakdown of your audience’s demographics (think job titles and industries), and even track trends over time.
For anyone focusing on sales, marketing, or recruitment, these advanced features can be a game-changer. They provide a richer understanding of engagement patterns and audience behavior, helping you make smarter, data-driven decisions about your content and strategy.
How does LinkedIn protect user privacy when sharing analytics data?
LinkedIn prioritizes user privacy by adopting clear data practices and empowering users to manage their information. The platform collects data strictly for defined purposes, such as enhancing its services and offering analytics insights, always ensuring that any data sharing aligns with privacy standards.
Users have the ability to personalize their privacy settings, allowing them to choose what information is gathered and how it’s utilized. Additionally, LinkedIn adheres to all applicable privacy laws and regulations, regularly refining its practices to strengthen data security and user control.